Creator Marketing Spending Forecast to Reach $116 Billion in 2026
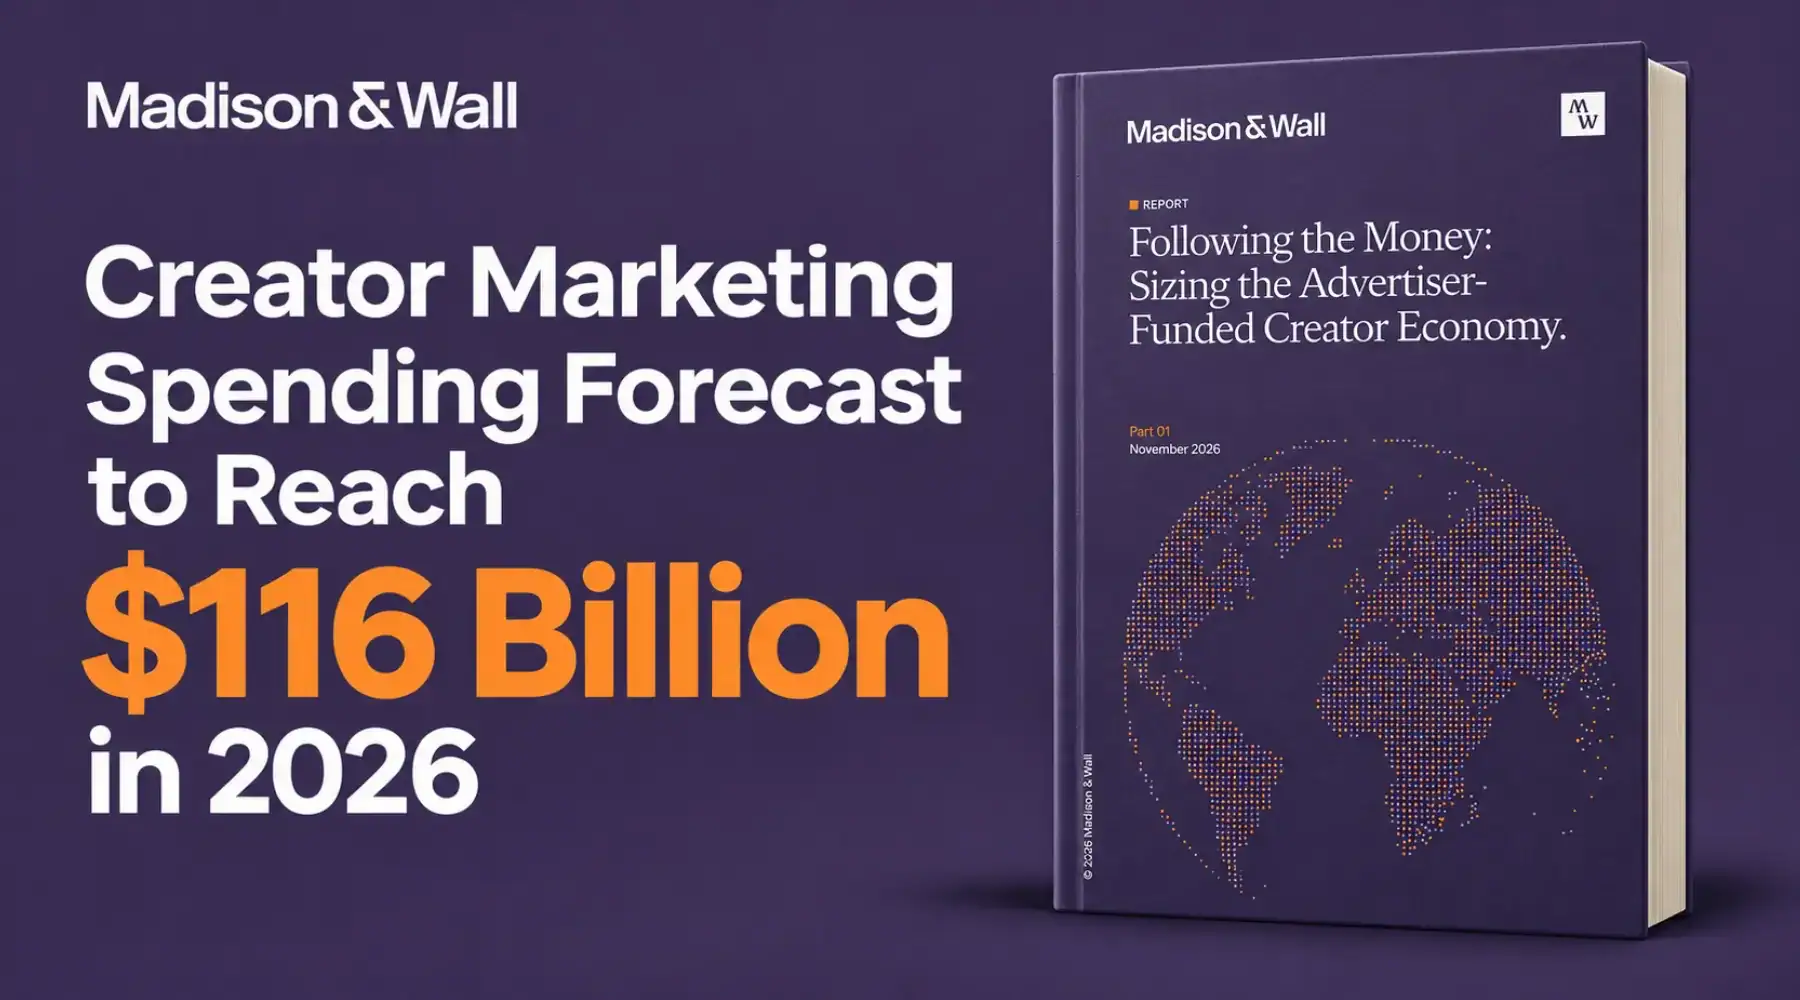
Global creator marketing spending in 2026 is forecast to reach $116 billion, up 15% from an estimated $101 billion in 2025, according to Madison & Wall’s November 18 research announcement. The research firm projects $178 billion by 2030.
The forecast covers money marketers spend on creator-related activity, including paid distribution, production, services, and affiliate commissions. It includes costs beyond the fees and commissions creators receive directly.
Key Takeaways on Creator Spending and Affiliate Budgets
- Global spending is forecast at $116 billion in 2026, up 15% from the firm’s 2025 estimate.
- Paid amplification takes the largest share, at a reported 44%, including the media inventory used to distribute creator content.
- Marketer-funded affiliate commissions are included, although the research does not provide a separate affiliate-commission forecast.
What the Creator Spending Forecast Includes
Madison & Wall’s Following the Money: Sizing the Advertiser-Funded Creator Economy, Part 01 separates buying access to a creator’s audience from buying content, distributing it through advertising, and paying third parties to support campaigns.
A sponsored post buys audience access. A video commissioned for a brand’s product page buys a content asset. Paying a platform to distribute that video buys media inventory.
Under the taxonomy, rights to reuse a specific creator-produced asset belong with asset-led spending. Broader licensing of a creator’s identity or intellectual property falls into miscellaneous activity.
Affiliate arrangements fall within audience-led activity when the creator generates traffic or transactions through their own distribution channels. Their inclusion connects this research to affiliate programs without making the total a measure of the affiliate industry.
Consumer subscriptions, tips, merchandise purchases, and other direct fan payments are excluded. Platform-funded creator payouts, including advertising revenue shares and creator funds, also sit outside the estimate.
Paid Amplification Takes the Largest Share
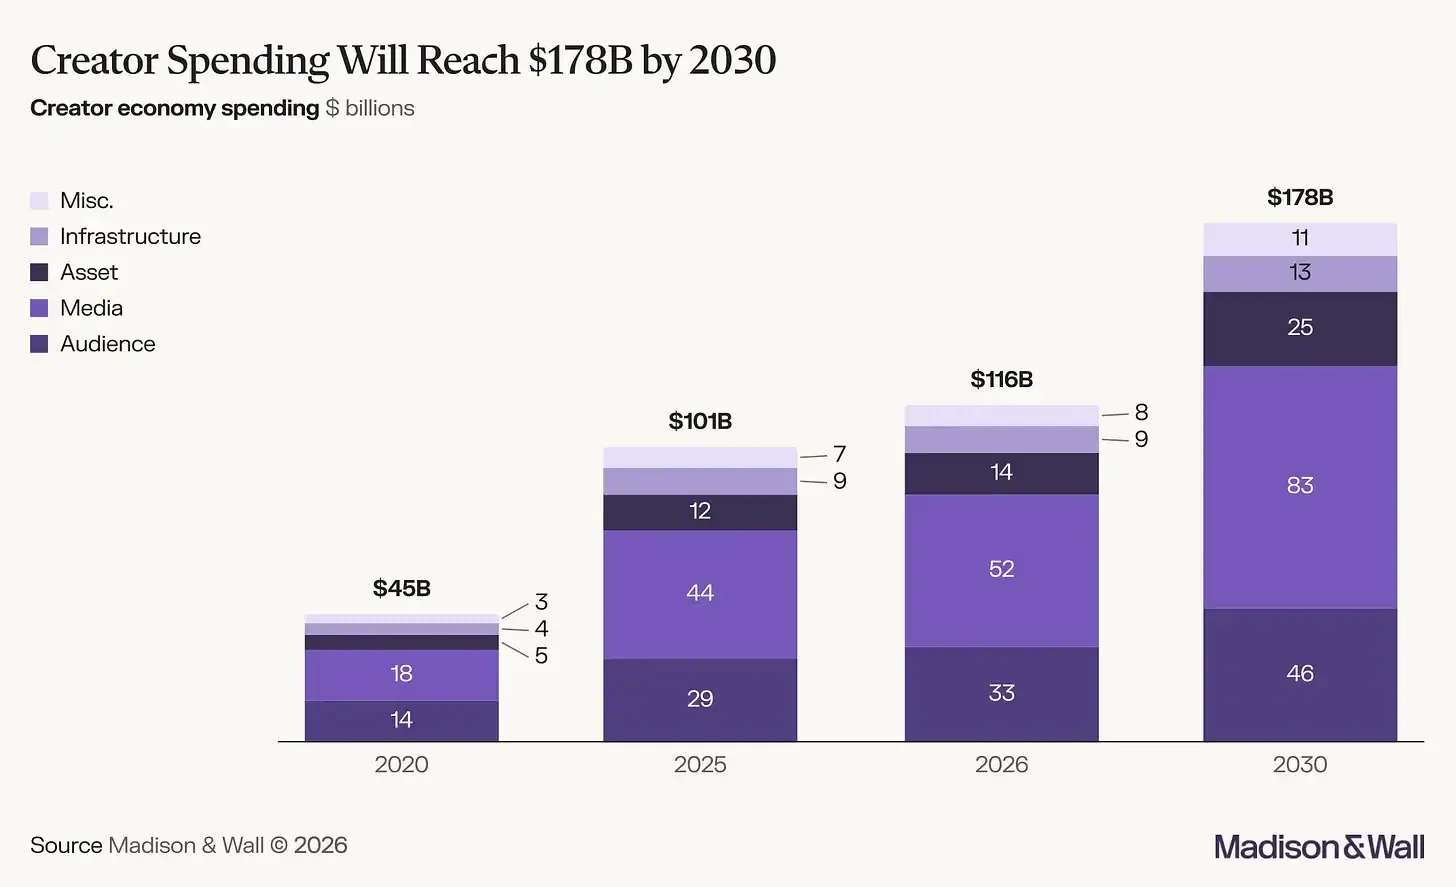
Madison & Wall forecasts media-led spending at $52 billion in 2026, with a reported 44% share. Audience-led activity follows at $33 billion, or 28%.
Source: Madison & Wall announcement
Asset-led content production represents 12% of forecast 2026 spending. Intermediary services, labeled “Infrastructure” in the graph, account for 8%, covering net fees retained by agencies, talent managers, and technology platforms. Miscellaneous activity, including events, gifting, and broader creator licensing, represents 7%.
Including media inventory is central to understanding the headline figure. If a brand pays a creator for a video and then buys advertising impressions to distribute it, that media purchase enters the estimate even though the platform receives the payment.
The forecast therefore captures spending across the campaign, including distribution and support services, as well as payments to creators.
Where Brands Are Finding Creator Budget
Madison & Wall attributes much of the category’s growth to shifts within existing marketing budgets.
Its November 18 summary states: “Creator growth is largely funded by reallocation rather than new money.”
The firm’s stakeholder interviews point to three sources: traditional media, particularly television; digital performance media, including paid social, programmatic, and search; and creative production budgets.
One change described in the research happens within paid social. A marketer can keep buying distribution while shifting some expenditure toward licensing and promoting creator-produced content. The creative input changes while the advertising budget continues funding distribution.
Production is another source, with creators competing for work previously assigned to agencies or production companies.
This is the firm’s assessment of funding patterns across the market. It does not establish how much money any individual affiliate program has gained or lost.
How the Market Estimate Was Built
The methodology appendix describes five sizing approaches: advertising revenue, industry-category spending, the gap between advertiser expenses and media-owner revenue, agency analysis, and influencer sampling.
These approaches combine modeling, public data, company disclosures, and stakeholder interviews. Different methods cover different spending categories; the firm averages the applicable estimates for each category.
The calculations depend on assumptions about creator adoption, pricing, and agency economics. Interview-based adoption estimates were adjusted to account for advertisers making little or no use of creators.
The result is a modeled market estimate, rather than a census of completed transactions or a consumer survey.
What the Forecast Means for Affiliate Teams
For affiliate program managers, the spending breakdown raises practical questions about what each partnership buys. Is the objective access to followers, reusable content, or validated sales? Which usage rights are included, and for how long? Does the reported campaign cost include production, paid distribution, services, and commissions?
Consider an illustrative agreement: a retailer pays $1,000 for video production and 60 days of reuse rights, offers an 8% commission on qualifying sales, and allocates $2,000 to paid distribution. The fixed fee, media cost, and commissions need separate entries when reconciling campaign costs and creator compensation.
Measurement also depends on the objective. Work toward common creator measurement can help teams compare exposure. Affiliate reporting must establish which orders qualify for commission under the agreed attribution rules, including how returns and cancellations are handled.
Levanta’s TikTok Shop integration offers an example of creator and affiliate reporting across marketplaces, bringing content-level Shop results alongside other marketplace reports. Shared reporting still requires a distinction between attributed purchases and broader creator influence.
The forecast gives teams context for those budget discussions. Higher overall spending does not establish better returns or guarantee higher commissions for an individual creator.
Everflow
Connect
Tradedoubler
Connect
1win Partners
Connect
Shopnomix, a Nomix Group Company
Connect
Huffson Group
Connect
Kawaii Partners
Connect
Trackdesk
Connect
Share your expertise and expand your reach and become a content contributor with us today!
Contact Us To Find Out More