Google Trends Adds Interactive Regional Maps: What Affiliates Can Learn From Local Demand
Google Trends is rolling out redesigned interactive maps and regional breakdowns in Explore, making it easier to see where interest in a search term or topic is concentrated.
Google Search Central announced the map update and said the experience would become available gradually. For affiliate marketers, the practical value lies in comparing regional demand signals before planning content, partnerships, and GEO-specific campaigns.
What Affiliate Teams Need to Know
- The maps are part of the newer Explore experience: Google has redesigned the regional view for clearer visual analysis and storytelling.
- The rollout is gradual: Some users may not see the updated maps immediately.
- Regional interest is relative: A high score does not necessarily mean a region has the largest number of searches.
- The data can support localization: Affiliates can use it to prioritize markets, content, and partner briefs.
- It is not a revenue forecast: Search interest should be checked against conversion, commercial, and compliance data.
What Has Changed in Google Trends Explore
Google says the new maps are designed to make regional patterns easier to identify and capture visually. Users can explore the “where” behind a search, compare locations, and present the resulting data in a clearer format.
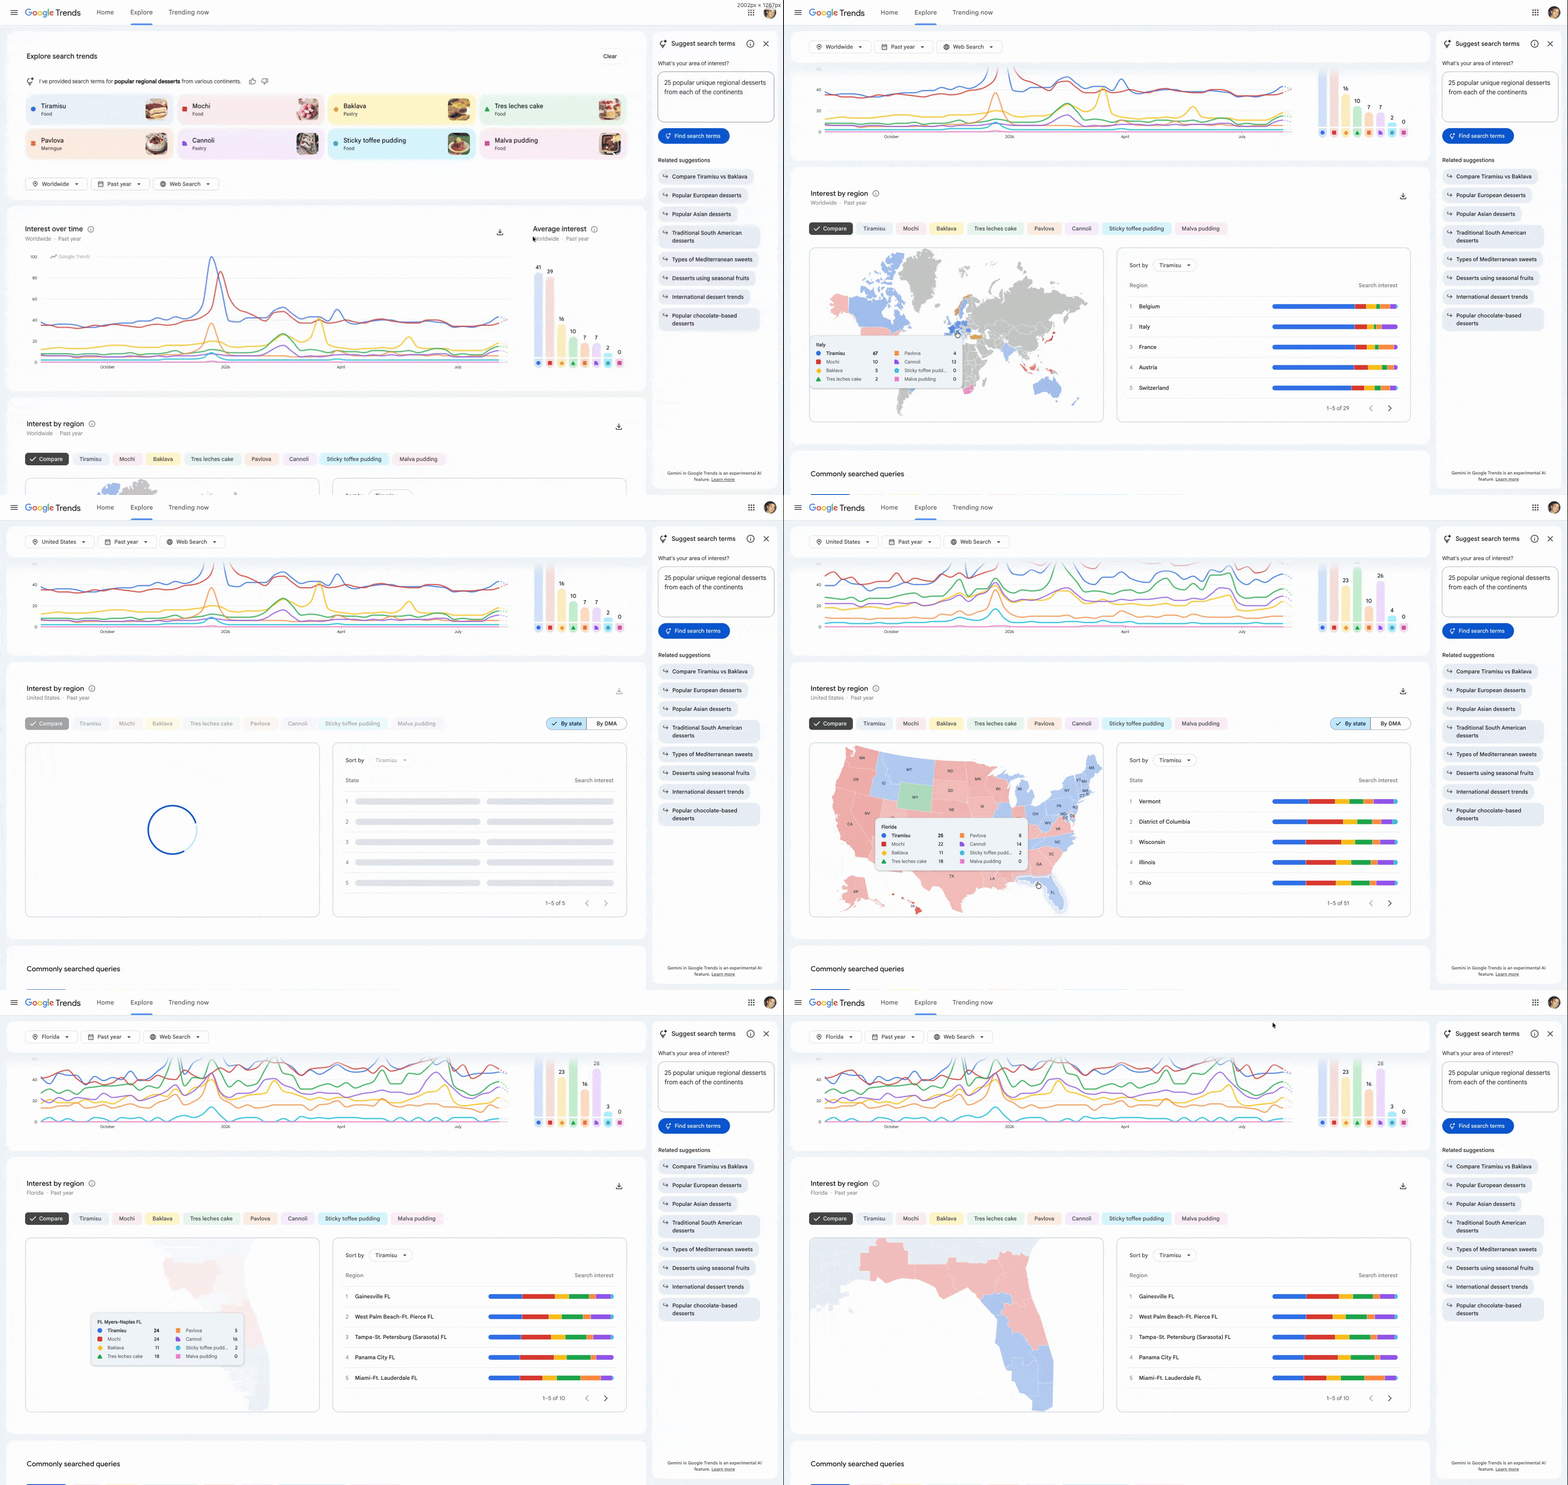
Source: Google Search Central LinkedIn post.
Regional interest itself is not a completely new Google Trends capability. The classic version already allowed users to examine interest by country, region, and, in supported markets, metro area. The story is the redesigned map experience and clearer regional breakdowns inside the newer Explore interface—not the invention of geographic Trends data.
That interface began rolling out in January with Gemini-assisted topic discovery, comparisons involving more search terms, and a larger set of rising queries. The newer Google Trends Explore experience is gradually bringing those research and visualization tools together.
Why Regional Search Interest Matters for Affiliates
National averages can hide meaningful differences between locations. A product category may appear stable across a country while demand is accelerating in particular cities, states, or regions.
For affiliates, that can influence several decisions:
- Which markets deserve a dedicated landing page or buying guide.
- Where to recruit local creators, publishers, or media partners.
- Which products or offers should be highlighted in regional campaigns.
- When seasonal demand begins to rise in different locations.
- Whether a merchant proposal has enough regional interest to justify a test.
The maps also complement Google Trends’ newer search-interest comparison tools. Time-based comparisons can show whether interest is rising or falling, while the map can show where that change is most concentrated.
A Simple Workflow for Affiliate Marketers
Regional data is most useful when it leads to a testable decision. Use this four-step workflow to turn a map insight into a localized campaign hypothesis.
1. Compare Terms That Represent a Real Decision
Start with competing brands, product categories, or consumer needs rather than an isolated keyword. Comparing alternatives provides more context than viewing a single trend score.
2. Look for Regional Differences
Use the map to identify locations where one term is unusually strong. A regional difference may suggest a local preference, event, regulation, retail footprint, or language variation worth investigating.
3. Validate the Signal
Check the pattern against SEO tools, paid-search data, site analytics, merchant performance, and your own conversion reporting. Search interest alone cannot show whether users are researching, comparing, or ready to buy.
4. Localise the Campaign
Adapt the offer, examples, currency, language, payment information, and promotional calendar for the selected market. Effective affiliate localization requires more than translating the same page into another language.
What the Maps Cannot Tell You
Google Trends does not report exact keyword volume. Its data is normalized to make locations and time periods comparable, with values typically presented on a scale from zero to 100. A smaller region can therefore rank highly because a larger share of its searches relates to the topic, even if a larger market produces more searches overall.
The maps also do not provide conversion rates, commission potential, customer value, or regulatory context. Strong interest in a gambling, finance, or health-related topic, for example, does not mean an affiliate campaign is permitted in that location.
Geographic detail varies as well. Google’s regional-interest guidance notes that metro-level data is available only for some countries.
A Regional Signal, Not a Commercial Answer
The redesigned maps make Google Trends easier to use for market discovery and visual storytelling. Their strongest value for affiliates is as an early signal: where to investigate, what to compare, and which regional assumptions deserve testing.
The maps can show where attention is concentrated. They cannot show whether that attention will convert. Affiliate teams will get the best results by combining regional search interest with first-party performance data and genuine local knowledge.
Everflow
Connect
Tradedoubler
Connect
1win Partners
Connect
PIN-UP Partners
Connect
Shopnomix, a Nomix Group Company
Connect
V.Partners
Connect
Huffson Group
Connect
Kawaii Partners
Connect
Share your expertise and expand your reach and become a content contributor with us today!
Contact Us To Find Out More