N1 Partners Marketing Case: 88.7% Event Visitor Engagement
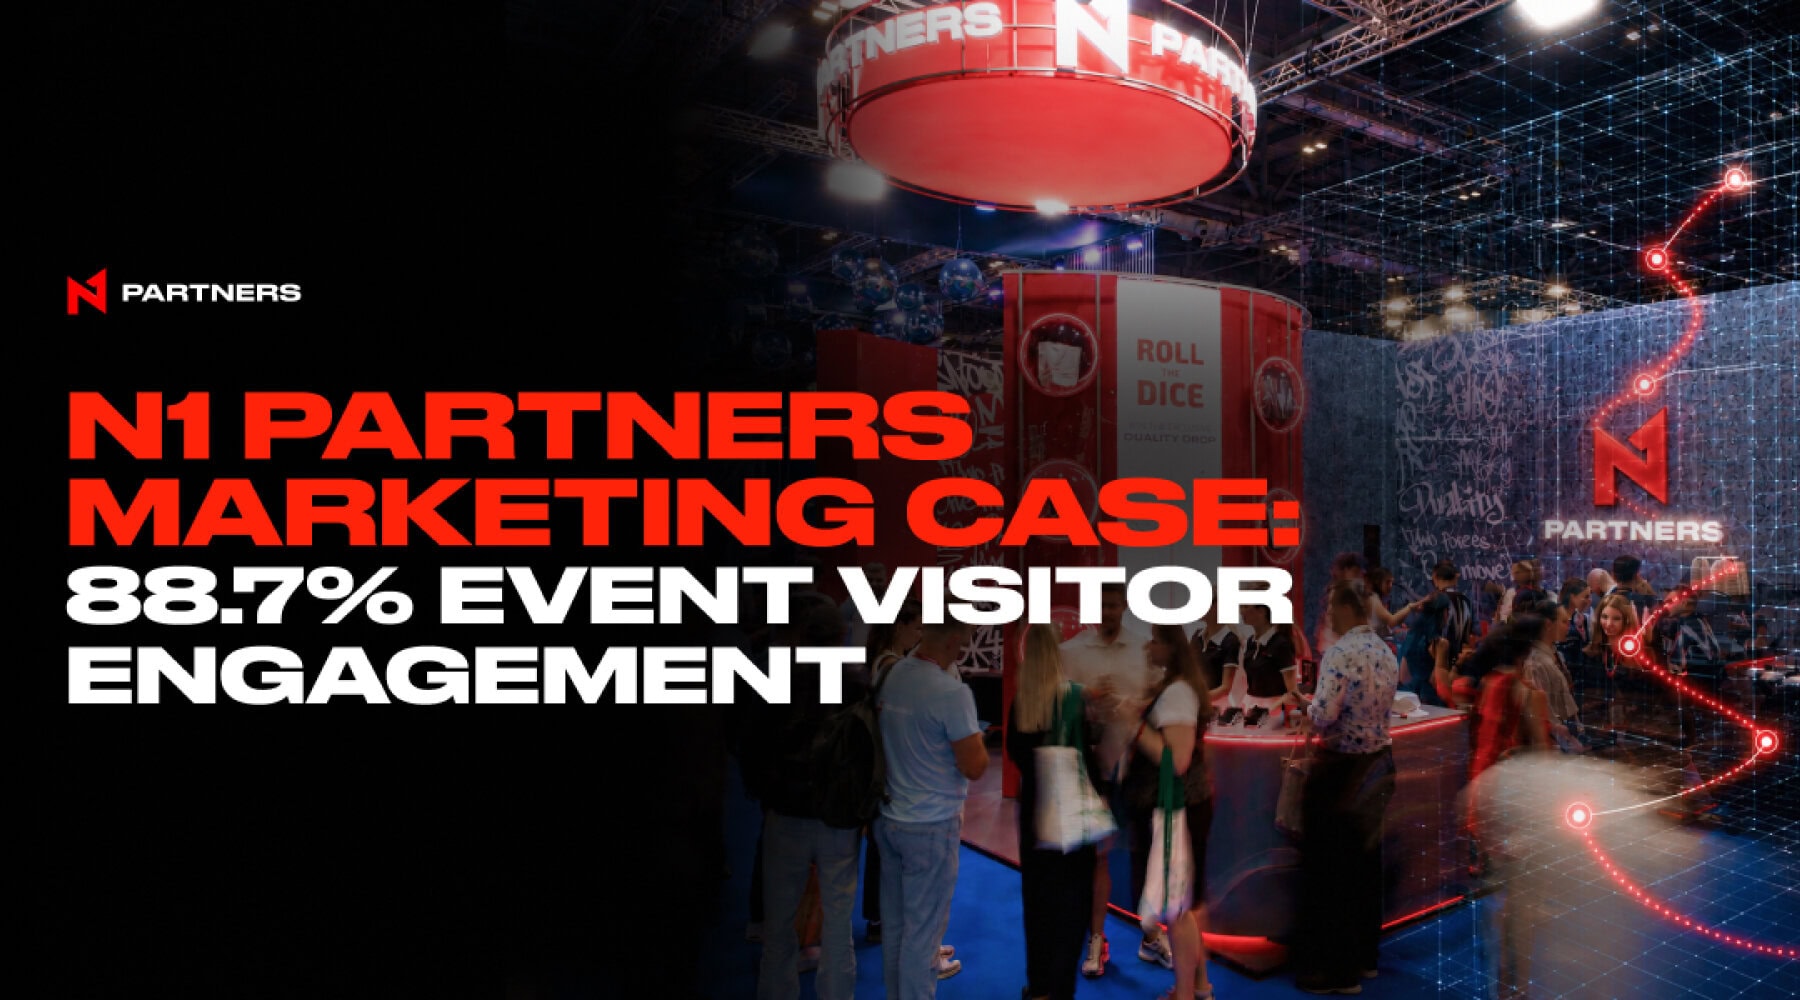
How can you understand how effectively a brand is represented at an exhibition? Companies typically evaluate their participation based on the number of meetings, new contacts relevance, and the negotiations outcome.
However, these metrics reflect only part of the picture. To assess the event marketing effectiveness more comprehensively, it is important to understand how the audience interacts with the brand throughout the entire journey, from the first point of contact to active engagement with the team.
N1 Partners, together with RexLab, applied a data-driven approach to audience behavior analysis at iGB L!VE 2026, complementing standard event analytics with visitor engagement data for the first time.
Goals Before the Analytics
Before the exhibition, N1 Partners marketing team identified several key questions to track the event effectiveness:
- What potential reach does the brand achieve at the exhibition?
- How does the audience move from the first point of contact to visiting the booth?
- At which stage is the largest drop-off of potentially engaged visitors observed?
- Which elements of the event experience attract the most attention?
- What solutions can be used to optimize future events?
Previously, the answers were based primarily on the team’s own observations and experience. While this provided a general understanding of audience behavior, it did not allow the findings to be statistically validated.
How The Data Was Collected
A network of sensors was installed at the N1 Partners booth to anonymously detect the presence of mobile devices within the coverage area. The system assigned each device an anonymized ID, making it possible to eliminate duplicate counting.
After the exhibition, the team received data on audience movement patterns, dwell time within the space, and transitions between the different stages of the funnel.
The analysis was conducted in two stages: first, the team examined the engagement funnel; then, they analyzed how attention was distributed across the space.
Engagement Funnel
To evaluate the effectiveness of working with the audience at different stages of the event experience, the N1 Partners team developed a funnel from potential contact to active interaction.
N1 Partners team developed a funnel ranging from potential exposure to active interaction to evaluate the audience engagement effectiveness at different stages of the event experience:
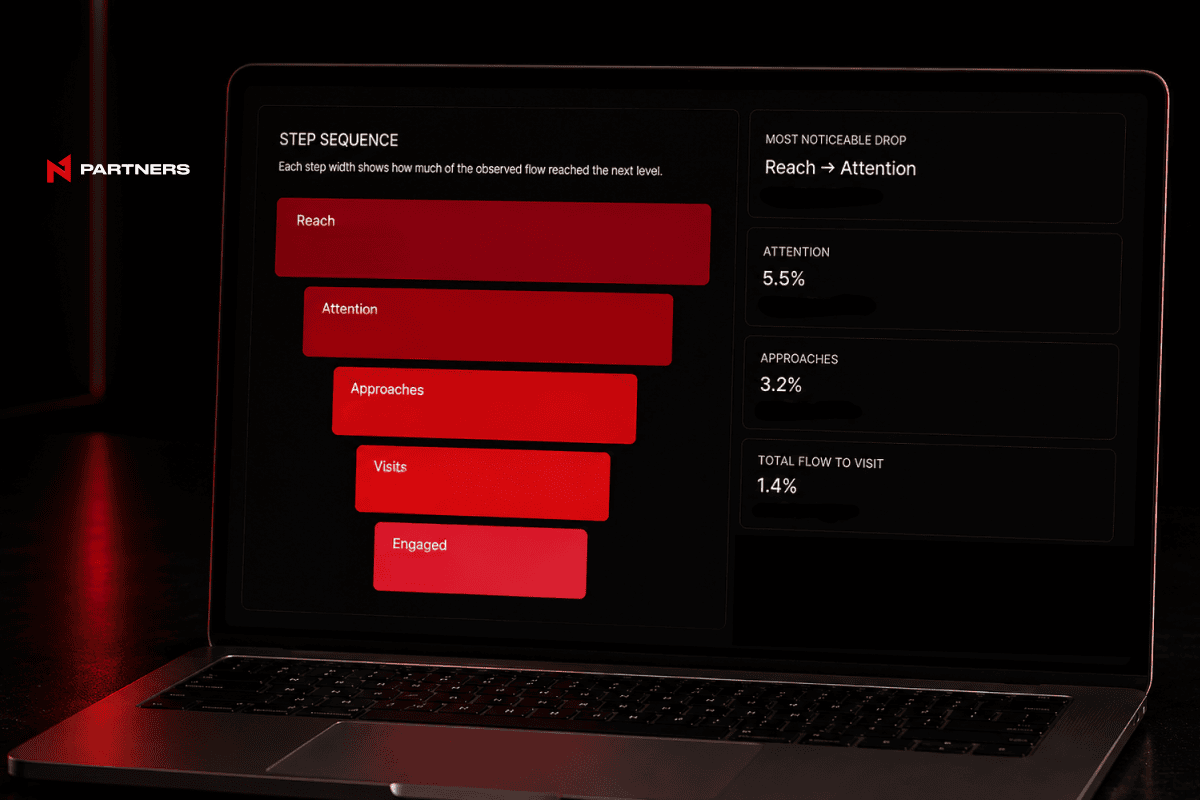
Reach → Attention → Approaches → Visits → Engagement
- Reach – the overall flow of exhibition attendees who were potentially exposed to the brand area.
- Attention – attendees who noticed the booth and its communications.
- Approaches – delegates who demonstrated additional interest and moved closer to the exhibition area.
- Visits – attendees who entered the N1 Partners space.
- Engagement – visitors who proceeded to actively interact with the booth and the team.
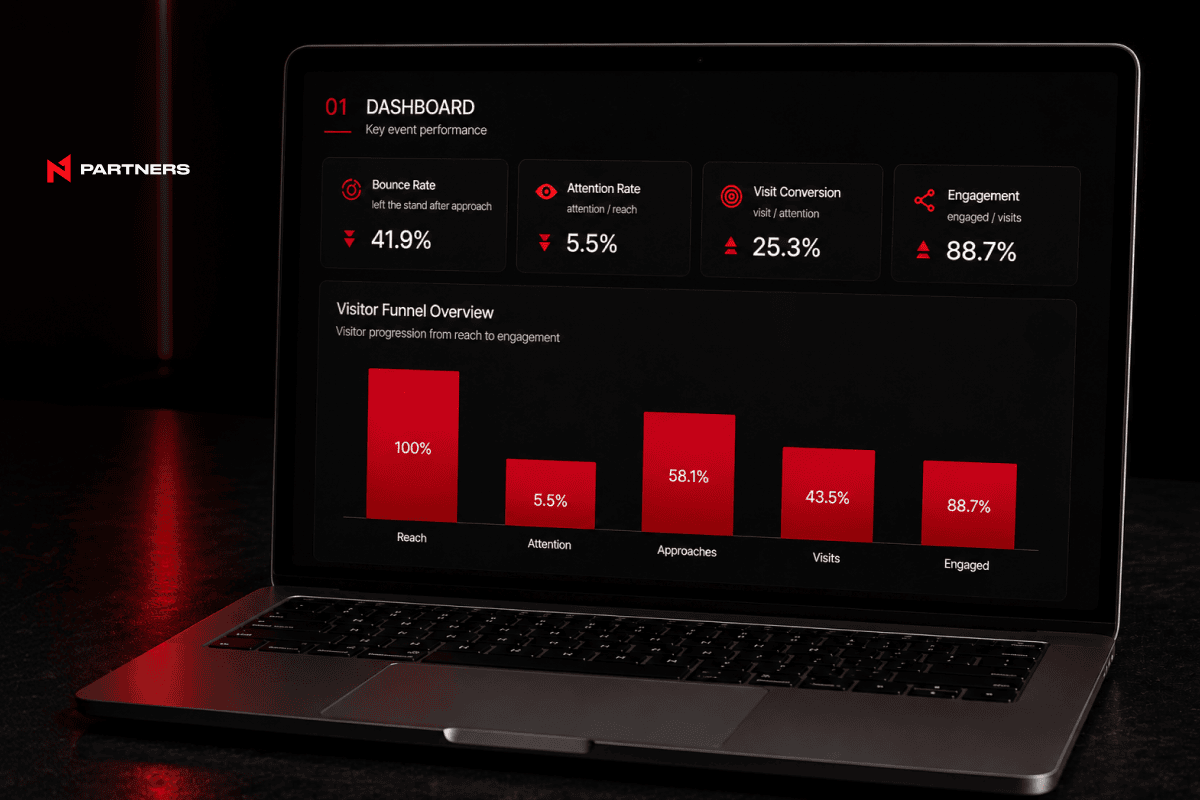
Of the overall attendee flow, 5.5% noticed the booth (Attention), representing approximately one thousand people.
At the same time, 88.7% of visitors who entered the space proceeded to actively engage with the brand. This indicates that the communication effectively filtered for the most interested audience: while only a smaller share of the overall traffic reached the engagement stage, those visitors were already highly relevant.
This means that the primary growth opportunity lies at the upper stages of the funnel – increasing attention and converting passing traffic into booth visits. At the same time, once visitors entered the space, they demonstrated a high level of activity.
Heat Maps
While the funnel shows how audience engagement changes across different stages, heat maps help identify what drives these changes and how visitors interact with the physical space.
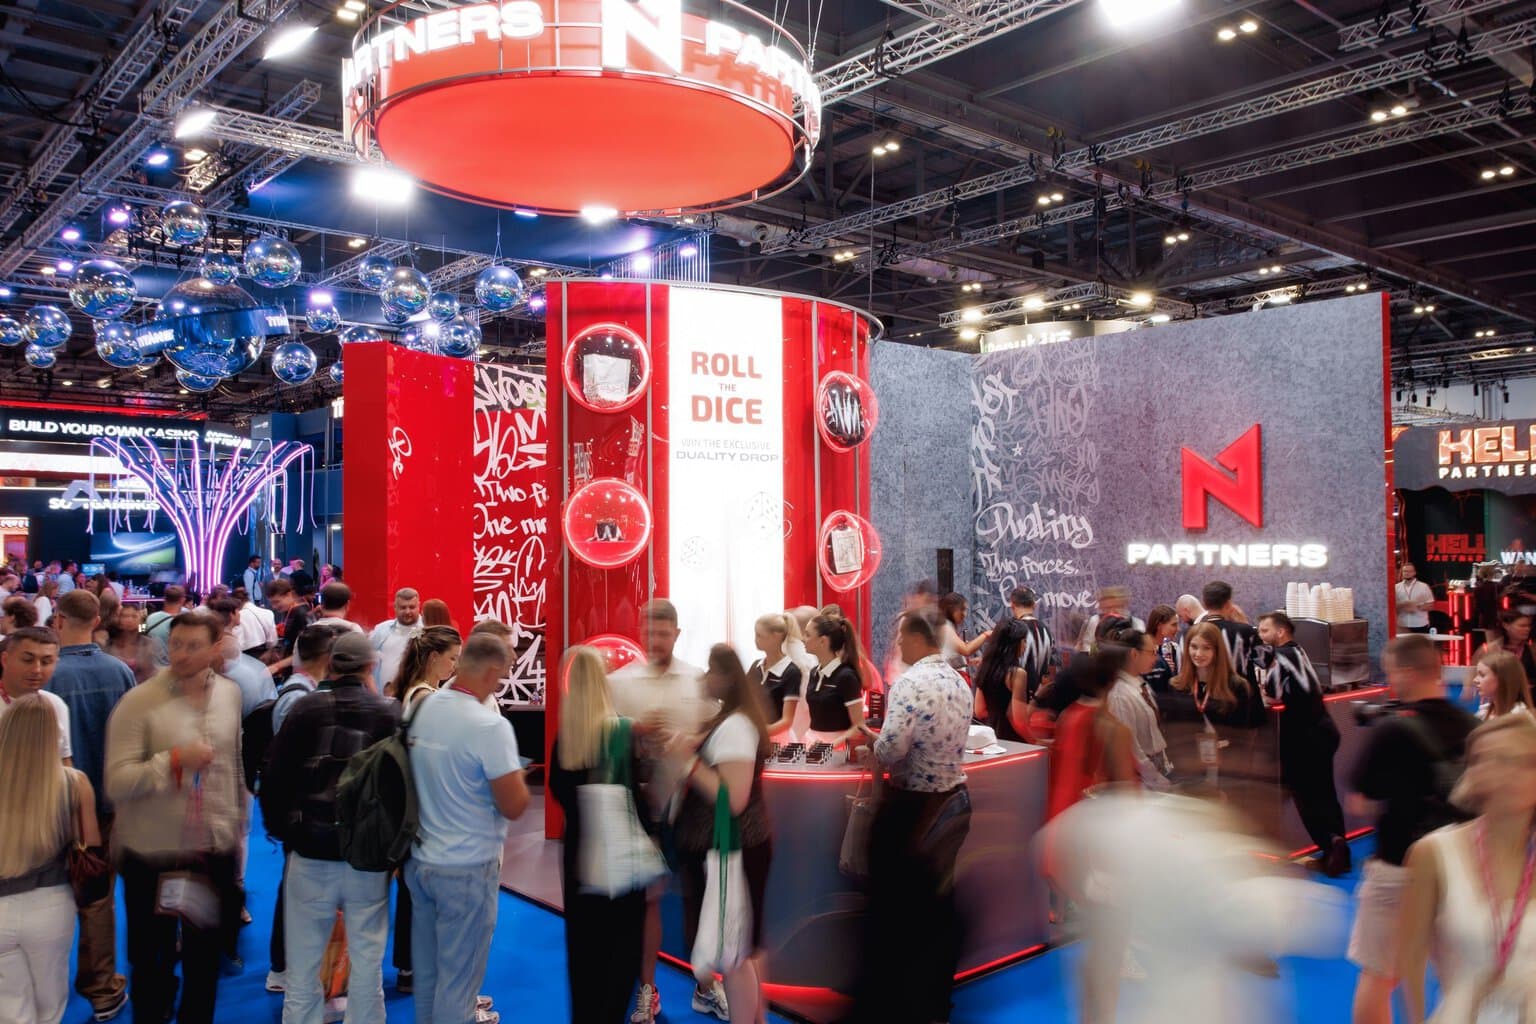
This method helped identify which areas became points of attraction, where attendees spent more time, and how they moved through the booth. These included the live art performance area by British artist Clym Evernden, who has worked with global brands including Hermès, Prada, Tiffany, and Diptyque, as well as a display featuring a limited-edition capsule collection created in collaboration with him.
The space also featured collectible toys by designer and creator Yoomoota, whose artworks have been exhibited at PAD London, Art Miami, and the Red Dot Museum, an activity zone, meeting rooms, and a bar.
The audience traffic distribution indicates a correlation between activity levels and interest in specific areas: live performances, exclusive objects, and interactive formats provided additional reasons for visitors to stay longer and engage with the booth.
The highest Peak Conversion was recorded between 13:00 and 14:00 on the first day of the event, reaching 214.4%. This demonstrates that the intensity of audience interaction can vary depending on the time of day, making it important to factor the most promising time slots into activity planning and team capacity management in advance.
During these periods, it is worth increasing staff presence in the relevant area, preparing communication scenarios in advance, and scheduling activities designed to convert increased traffic into deeper engagement. Going forward, analysis of peak periods can be used to optimize activity schedules and resource allocation at the booth.
According to RexLab, this metric represents the ratio of the number of booth visitors to the number of people who passed by the booth during a selected period. Therefore, the figure can exceed 100%.
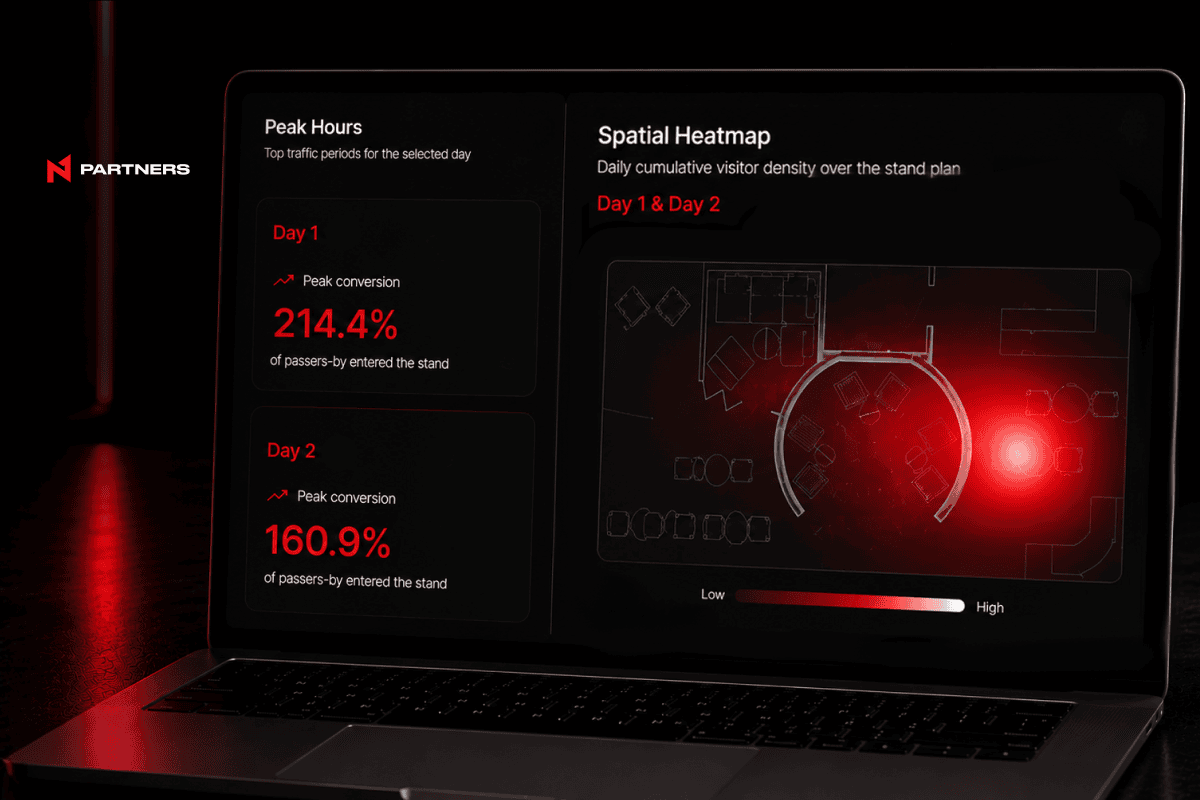
These results can be taken into account when preparing for future conferences – for example, when changing the layout of different zones or testing new audience flow scenarios.
What The Case Study Showed
The data collected and the subsequent analysis highlighted three key findings:
- High engagement among the target audience: conversion after entry – 88.7% of visitors who entered the space proceeded to actively interact with the team.
- The main growth potential lies at the upper stages of the funnel: increasing attention and driving more booth visits.
- The quality of interaction depends on zone placement, audience flow, and timing – the highest Peak Conversion was recorded on the first day, reaching 214.4% between 13:00 and 14:00.
Checklist: Questions to Ask After an Exhibition
The iGB L!VE experience helped the team formulate four questions that should be considered when evaluating future events.
After an event, it is important to analyze not only the final performance metrics but also the decisions that can influence future participation:
- Which booth elements should be retained?
Identify the zones, activities, and engagement formats that delivered the strongest results. - What can be changed in the next project?
Identify areas for improvement – from zone placement to visitor flow scenarios. - Which hypotheses should be tested next?
For example, changing the attendee journey, reallocating space, or introducing new touchpoints. - What should be compared with previous events?
Track how changes to the booth concept affect audience attention and engagement.
This approach makes it possible to carry insights from one exhibition into the planning of the next: retaining effective solutions, adjusting zone placement, and testing new approaches to organizing the space.
Insights: From Analysis to Action
The data makes it possible to move beyond evaluating individual events toward the systematic optimization of event marketing and to develop hypotheses for future event projects.
| Space | Optimize zone placement and audience flow scenarios. |
| Engagement | Test touchpoints and interaction formats in advance. |
| Timing | Schedule activities around periods of peak visitor activity. |
| Benchmarking | Compare performance across events and track it over time. |
| Testing | Test new solutions and evaluate their impact on engagement. |
This way, event marketing becomes not a one-off activity, but a continuous process of analysis, testing, and optimization.
N1 Partners continues to develop its partner ecosystem and create opportunities for long-term collaboration.
With N1 Partners affiliates get:
- 14+ casino and betting brands with high Reg2Dep and LTV
- 10+ Tier-1 GEOs
- CPA up to €700 and RevShare up to 55% + NNCO for top partners
If you would like to discuss marketing collaborations, content projects, media placements, PR and SMM activities, N1 Partners marketing team will be happy to explore potential cooperation formats.
Team contacts:
Be number one with N1!
_________________________________________________________________________________________
This content has been produced for Affiverse by an independent Advertiser and expresses their own views, in their own words. If you would like to feature as an advertiser and be interviewed on Affiverse’s media content platform, please email [email protected].
Everflow
Connect
Tradedoubler
Connect
1win Partners
Connect
PIN-UP Partners
Connect
Shopnomix, a Nomix Group Company
Connect
V.Partners
Connect
Huffson Group
Connect
Share your expertise and expand your reach and become a content contributor with us today!
Contact Us To Find Out More